The course will explore:
- The importance of data visualisation in knowledge translation
- Understanding your audience and how best to communicate to them
- Principles of data visualisation
- 6-step process behind conceptualising and designing a data visualisation and an infographic
- Incorporating data storytelling into your designs
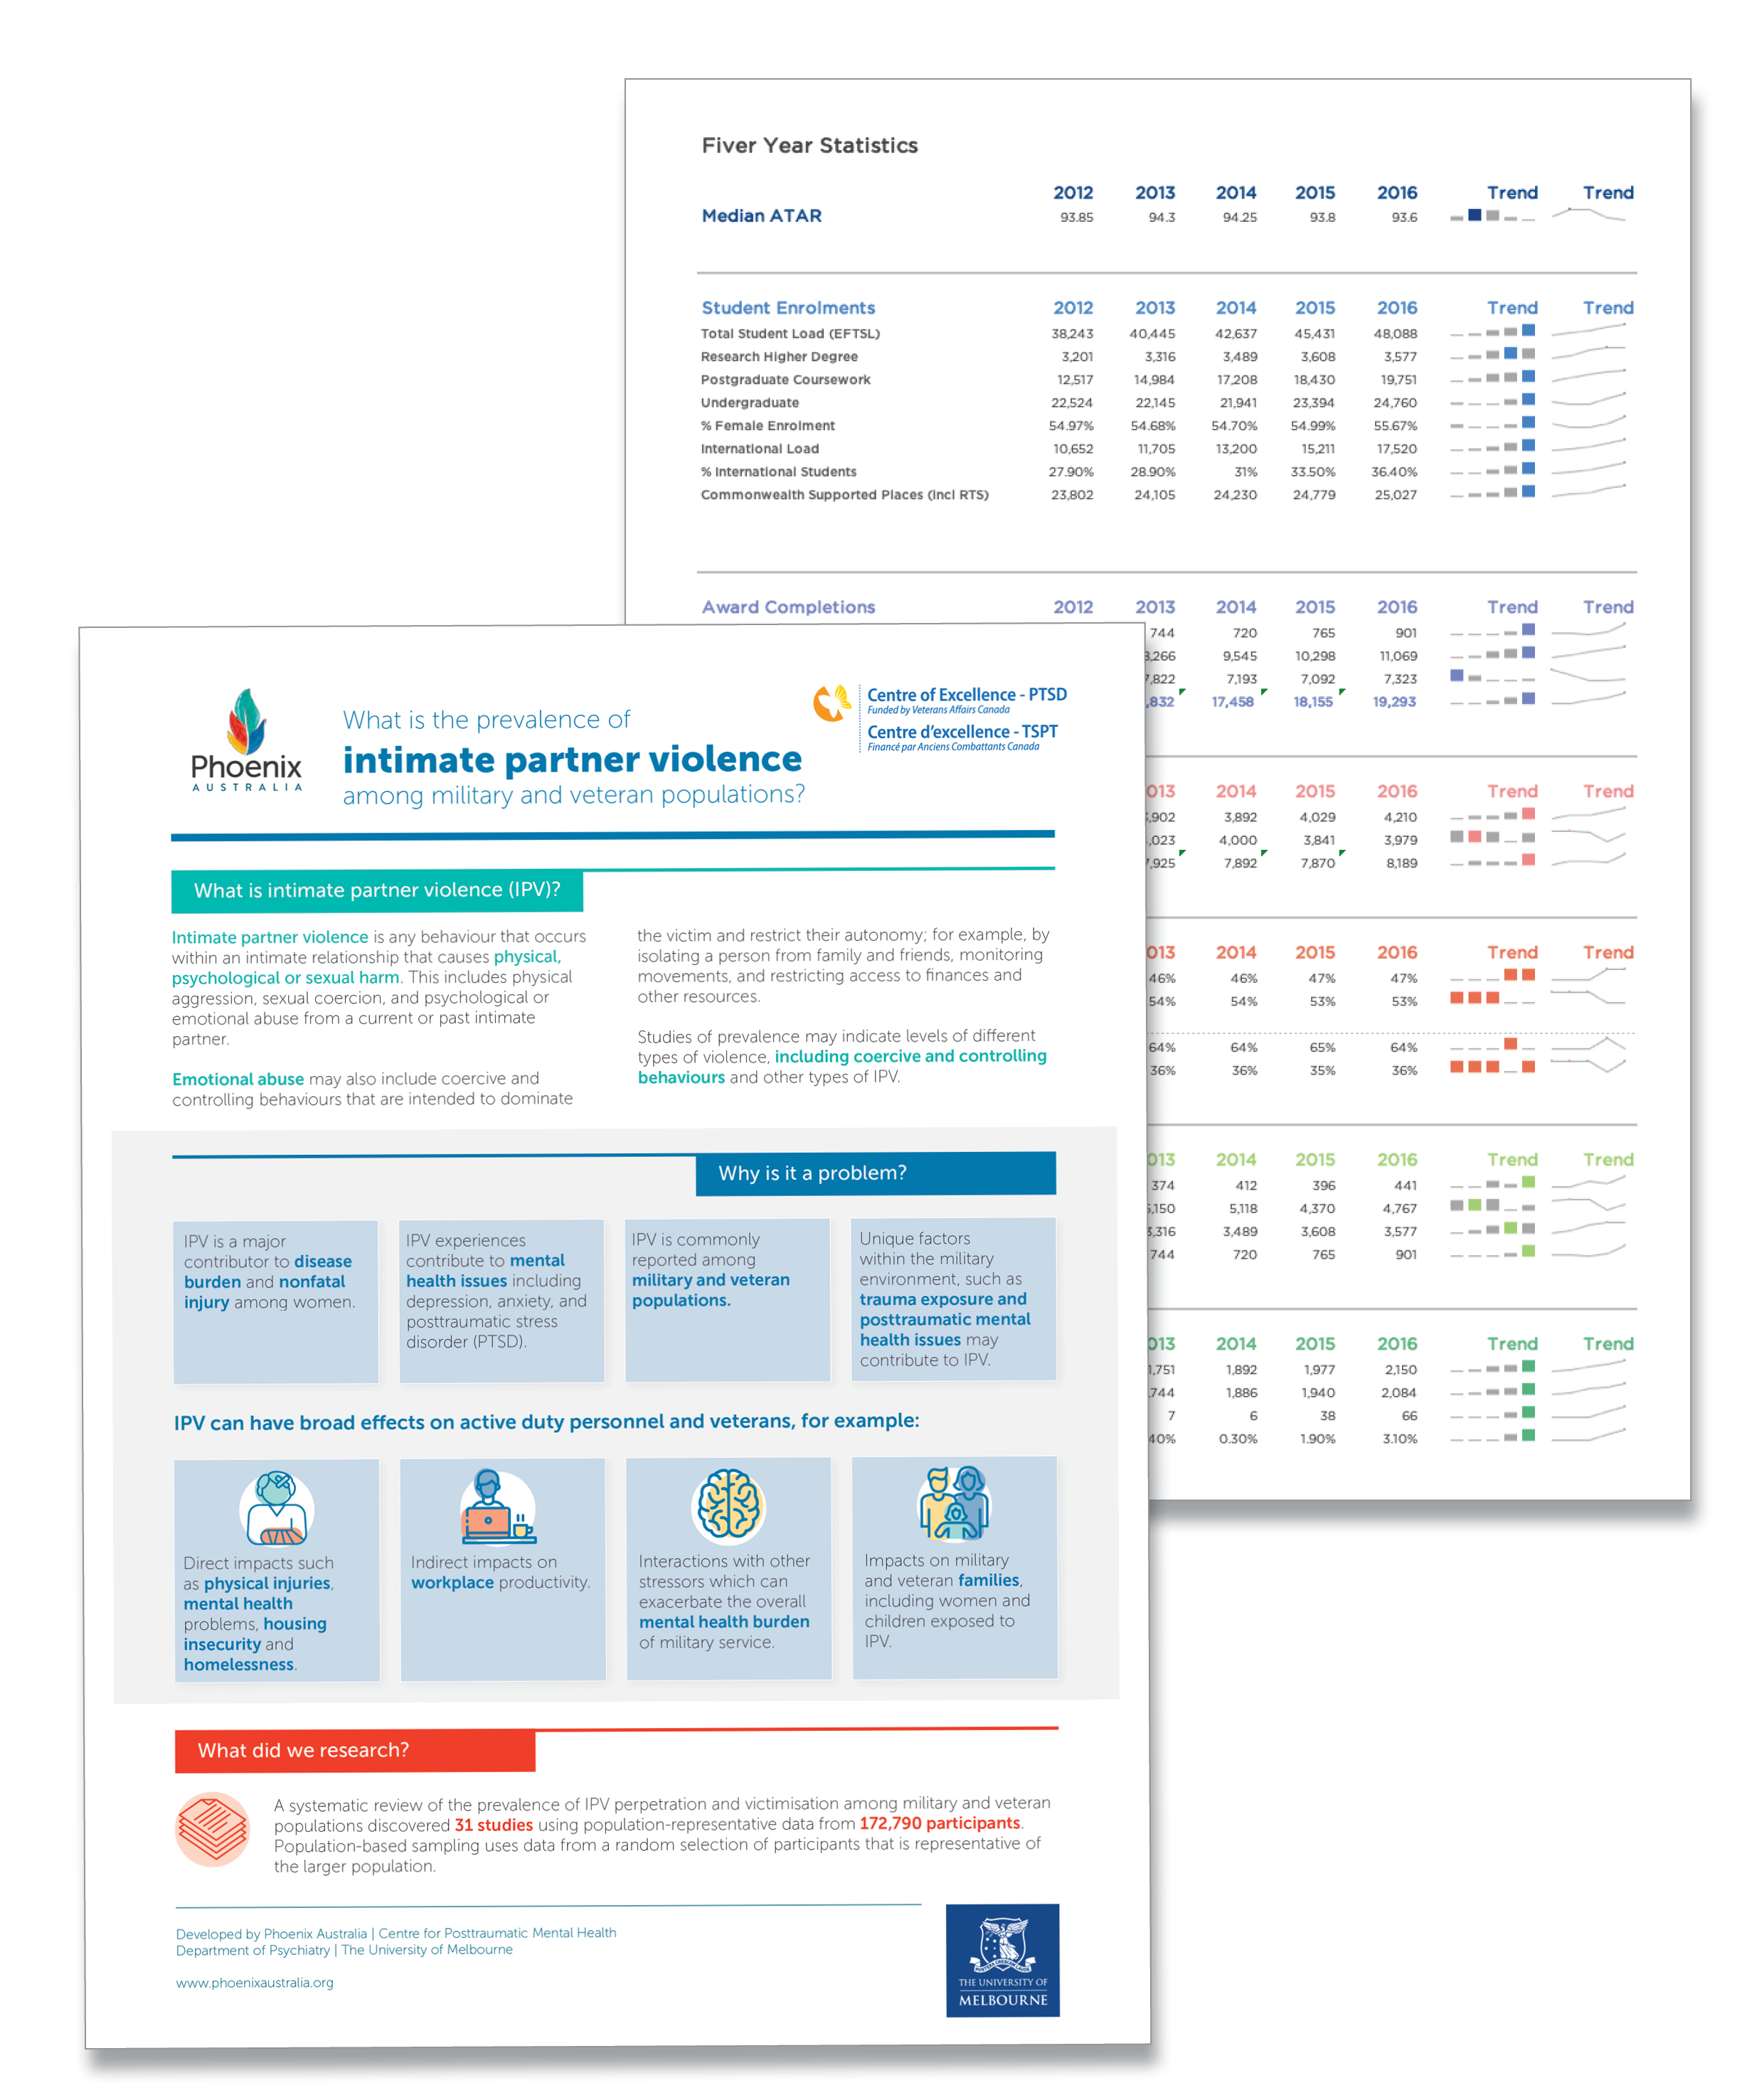
- Designing a research summary infographic
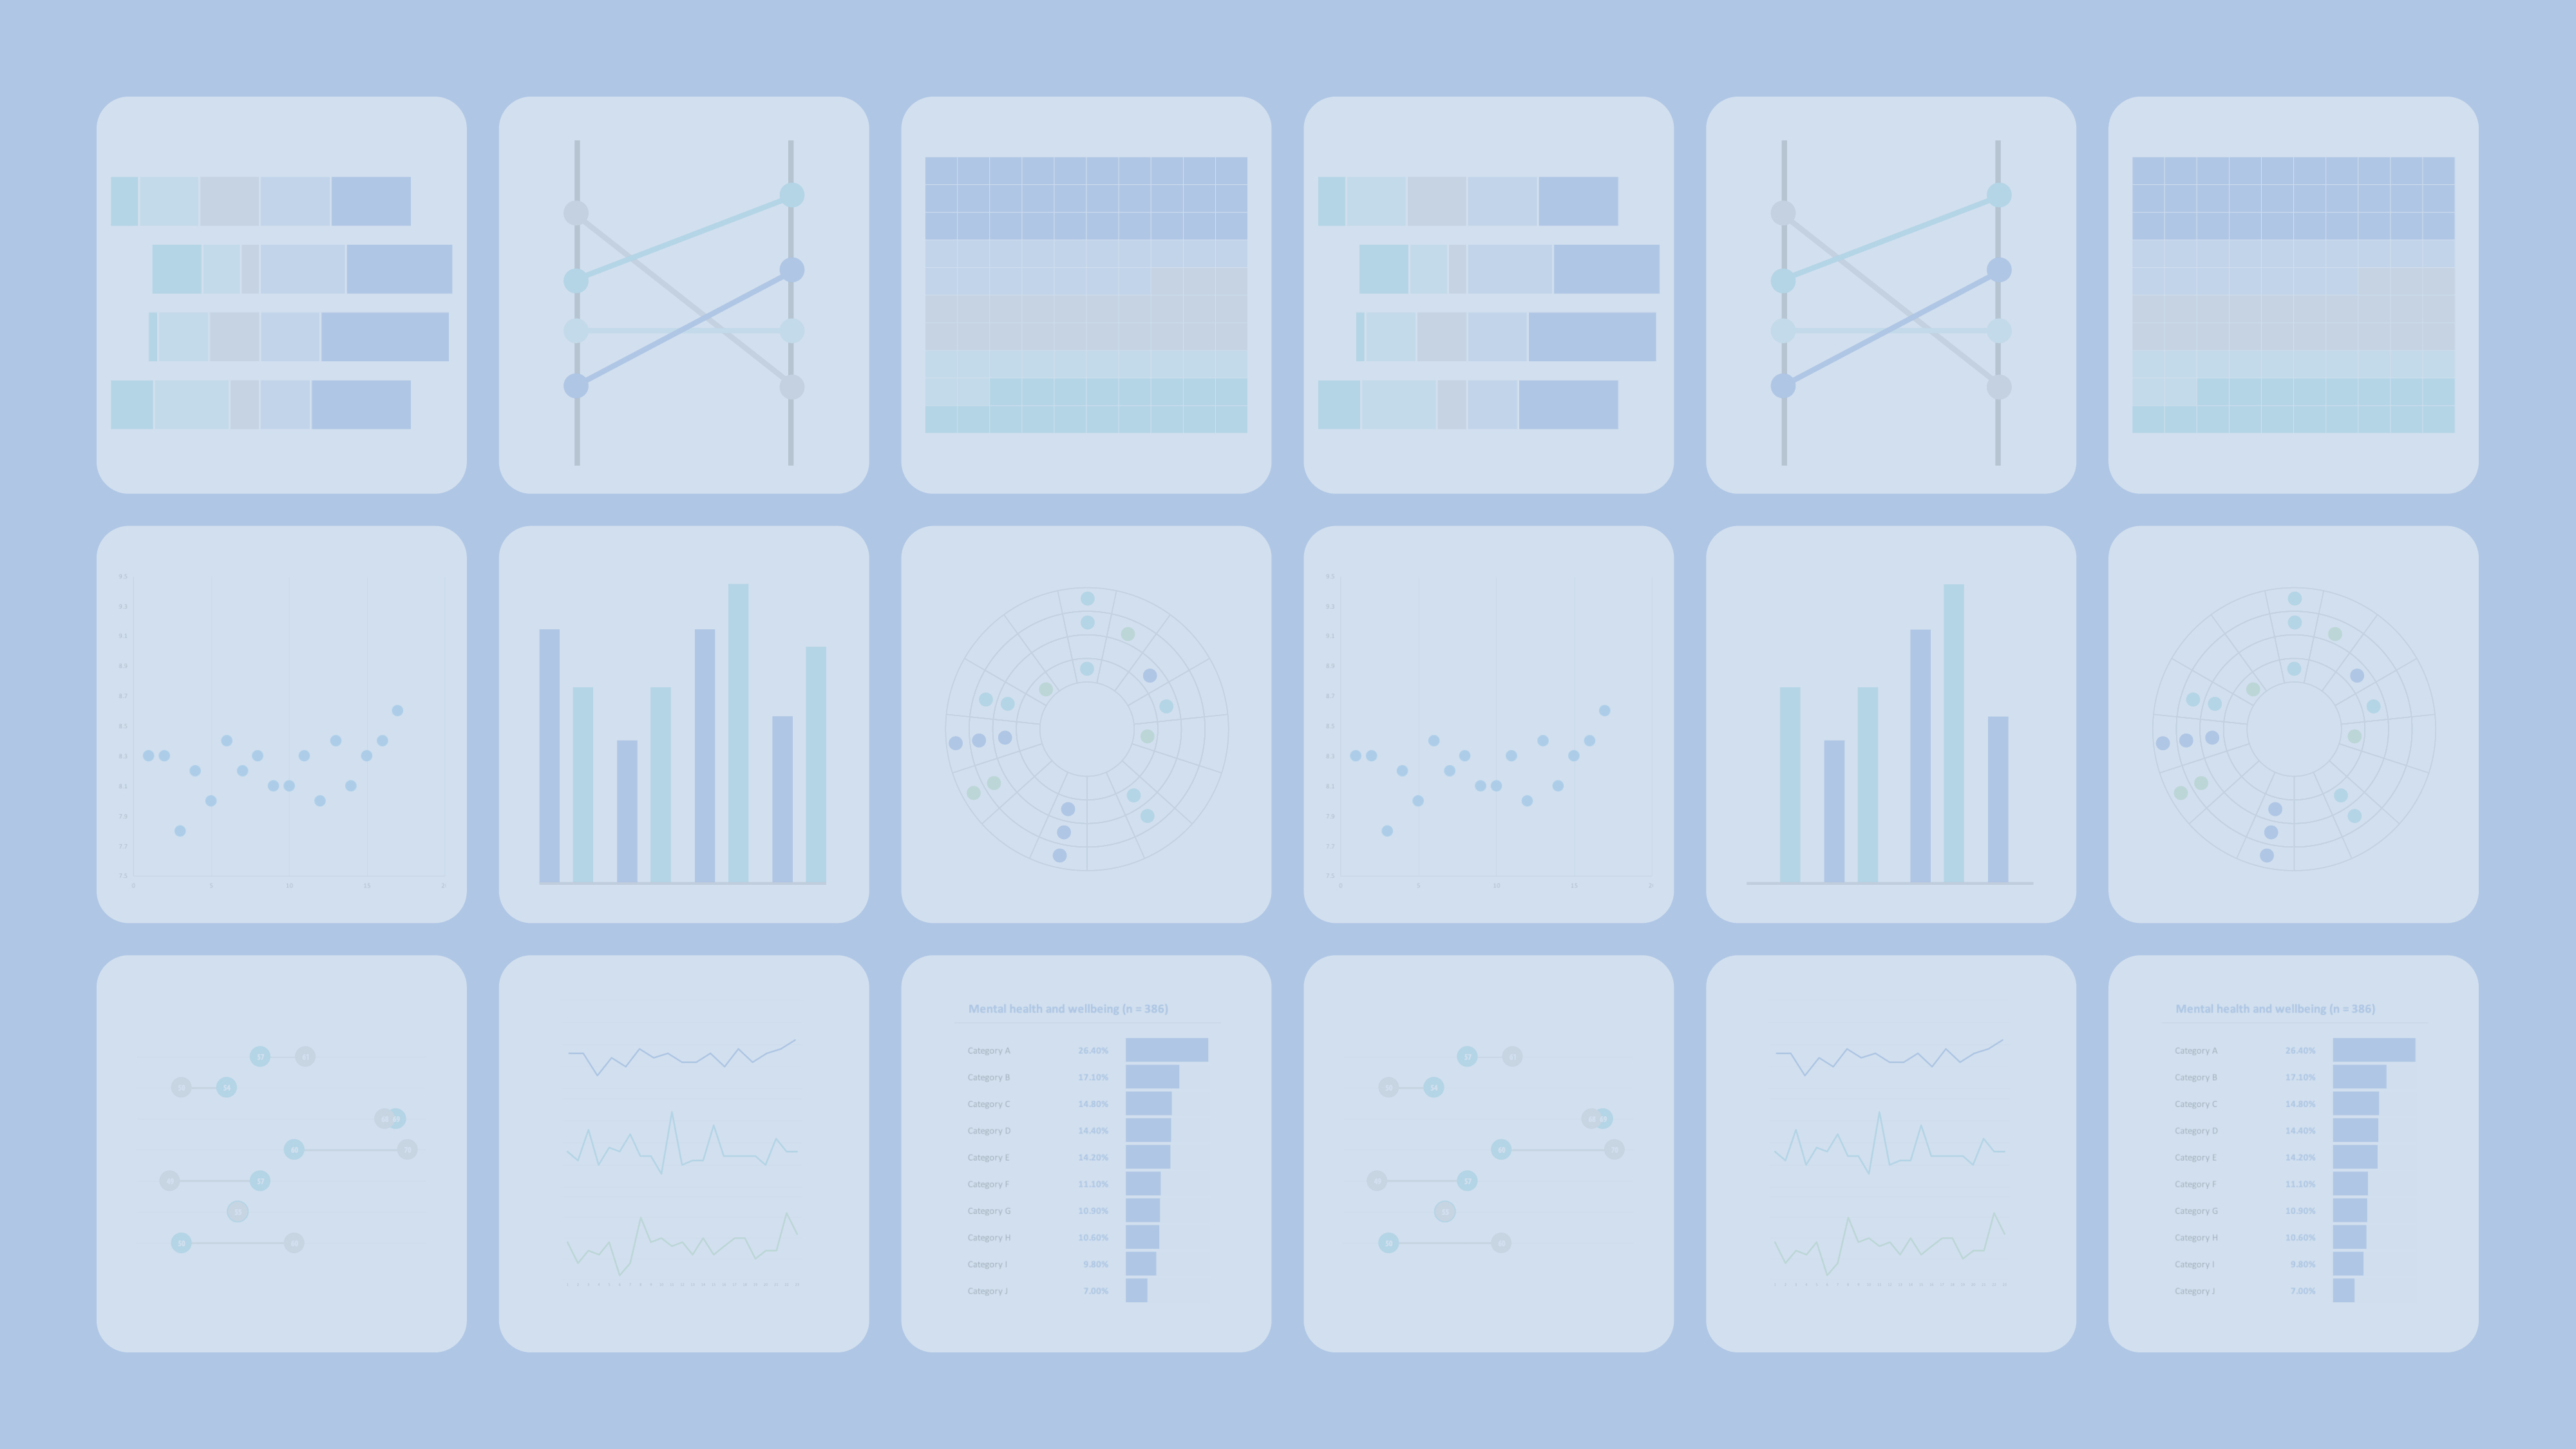
- Designing charts in Excel including: small multiples bar chart, slope chart, icon array, heat map and sparklines.
- Exploring different chart types and their functions
- How to use visual attributes to make your designs more elegant, easy to understand and interpret
- Practical activities and a wide range of online references for further information.
About Alana
Alana Pirrone is a Design and Data Visualisation Consultant. She is also the Design and Communications Coordinator for Child and Community Wellbeing Unit (previously the Jack Brockhoff Child Health and Wellbeing Program) at The University of Melbourne.
She specialises in data visualisation for knowledge translation. Utilising the Adobe Creative Cloud suite and Microsoft Office suite, Alana has expertise in designing infographics, data visualisations, technical and plain language reports, conference presentations and other knowledge translation materials. Alana has particular experience in translating public health research outcomes into visual designs, and has been commissioned by the World Health Organisation, independent consulting firms, community health services and non-for-profits.

What's in the course
- Session 3 slides
- Process of designing a data visualisation (12:22)
- Process of designing a data visualisation example (4:39)
- Activity: Transforming a chart using data storytelling (0:52)
- Process of designing an infographic (4:02)
- Process of designing an infographic example (4:03)
- Research summary infographic (5:13)
- Activity: Create a research summary infographic (12:19)
- Session 4 slides
- Introduction to all about charts (2:07)
- Comparisons (1:45)
- Activity: Small multiple bar chart (10:14)
- Activity: Data bars (4:09)
- Activity: Spectrum display (1:25)
- Part to whole (3:23)
- Activity: Waffle chart (6:17)
- Activity: Pictorial fraction chart (5:54)
- Changes over time (1:04)
- Activity: Sparklines (4:14)
- Activity: Slope chart (9:29)
- Relational (0:50)
- Activity: Heat map (5:26)
- Geographical and concepts (2:10)